Customization Flexibility for Brands: A Data-Driven Look at Platform Tradeoffs
The customization debate in brand-led eCommerce has historically been argued on principle: open-source platforms offer flexibility, SaaS platforms offer simplicity, and each side claims the other gives up too much. The actual data on brand outcomes tells a more interesting story. The platforms with the most flexibility do not consistently produce the brands with the strongest customer experiences. The platforms with the most constraints sometimes produce the brands with the highest velocity. The right answer depends heavily on the brand's specific situation, and the data points worth attending to are different from the principles that dominate platform marketing.
This is a look at the data that should actually shape platform decisions for brand-focused eCommerce, drawn from industry research and patterns across commerce engagements.
The Customization-Velocity Tradeoff
The most important data pattern is the tradeoff between customization flexibility and execution velocity. Platforms with more customization flexibility allow more brand-specific differentiation but tend to produce slower execution cycles. Platforms with less customization flexibility produce faster execution cycles but more generic experiences.
The pattern is not absolute. Skilled teams can execute quickly on flexible platforms, and constrained teams can execute slowly on simple platforms. But the pattern shows up consistently in aggregate data: brands operating on highly customizable platforms ship fewer customer-facing changes per quarter than brands operating on simpler platforms.
The implication is that customization flexibility costs something real. The cost is not just the development effort for each customization; it is the operational tax on every subsequent change. A site with extensive customization takes longer to A/B test, longer to refactor, longer to upgrade, and longer to onboard new team members onto.
Brands that need high velocity — frequent product launches, frequent campaign updates, frequent experimentation — often perform better on platforms that constrain customization. Brands that need deep differentiation — complex product configurators, distinctive checkout flows, narrative-heavy commerce experiences — often perform better on platforms that support customization.
The Conversion Data on Customization
Conversion rate data offers another lens. The pattern in published research is consistent: the relationship between customization and conversion is not monotonic. More customization does not always mean better conversion. Some customizations help; some hurt; many are neutral.
The customizations with the most consistently positive conversion data:
Custom PDP architecture for high-consideration products. The conversion lift from purpose-built PDPs for complex products is typically in the 15-40% range over generic templates, with the lift increasing as product complexity increases. According to research from the Baymard Institute on PDP usability, the elements that distinguish high-converting PDPs are consistent: substantive product description, comparison tools, social proof, and clear shipping/returns visibility — all of which require some level of customization to implement well.
Custom checkout flows for distinctive products. Subscription enrollments, configured products, and gift purchases each benefit from custom checkout treatment, with conversion lift typically in the 10-25% range over generic checkout.
Brand-specific search and discovery customization for deep catalogs. Brands with 1,000+ SKUs benefit measurably from custom search and discovery patterns. Catalogs under 500 SKUs typically gain less from this customization.
The customizations with the most consistently negative conversion data:
Aggressive popups and interruption modals. Despite their short-term conversion benefit, the long-term retention and brand-experience cost typically exceeds the gain for premium brands.
Heavy custom navigation that diverges from common patterns. Customers expect certain navigation patterns; significant divergence increases cognitive load and depresses conversion.
Excessive feature density on homepages and category pages. Pages that try to support too many use cases produce confusion that depresses conversion across all use cases.
| Customization Type | Typical Conversion Impact |
|---|---|
| Custom hero-product PDPs | +15-40% |
| Custom checkout for distinctive flows | +10-25% |
| Custom search/discovery (deep catalogs) | +5-15% |
| Custom homepage with focused messaging | +5-15% |
| Aggressive interruption modals | Short-term +3-8%, long-term negative |
| Heavy custom navigation | -5-15% |
| Excessive homepage feature density | -10-20% |
The Total Cost of Ownership Data
The TCO data on customization is illuminating. Brands typically estimate the cost of customization based on the initial build effort. The actual cost is materially higher because of the ongoing maintenance burden.
A rough rule from the consulting literature: each significant customization adds approximately 10-15% to the platform's ongoing maintenance cost across the customization's working life. A platform with 10 significant customizations has roughly double the maintenance cost of an out-of-the-box deployment. A platform with 30+ customizations has 4-5x the maintenance cost.
This math does not argue against customization. It argues for selective customization. The customizations that earn the maintenance tax through ongoing business value are good investments. The customizations that do not are technical debt.
The brands with the best TCO outcomes are typically not the ones with the most customization or the least. They are the ones with deliberate customization: each item justified by clear business outcome, each item reviewed periodically, items that have aged badly retired rather than maintained indefinitely.
The Platform-Specific Data
Different platforms produce different customization economics. The pattern across brand-focused engagements is consistent.
Adobe Commerce and Hyvä. Brands operating on Adobe Commerce with Hyvä storefronts typically achieve strong customization-to-cost ratios when the customization is concentrated in storefront design and PDP architecture rather than in back-office workflows. The Hyvä framework's Tailwind foundation supports significant design customization at lower cost than equivalent Luma-based customization. For brands willing to operate the platform, this is one of the most efficient customization environments available.
Shopify Plus. Brands on Shopify Plus typically achieve the fastest customization velocity for changes that fit Shopify's architecture (theme customization, app integration, custom checkout extensions). Customizations that fight Shopify's architecture (deep backend modifications, complex custom workflows) often produce TCO worse than equivalent customization on flexible platforms. The right pattern is to customize aggressively with the platform's grain and not at all against it.
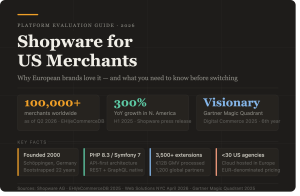
Shopware. Brands on Shopware typically achieve customization economics similar to Adobe Commerce, with stronger European market fit and slightly different ecosystem characteristics. Brands operating primarily in European markets often find Shopware's customization environment well-aligned to their operational reality.
BigCommerce. Brands on BigCommerce typically achieve customization economics similar to Shopify Plus, with stronger B2B support and slightly different storefront architecture options.
The Maturity Curve Data
Brand customization patterns evolve predictably as brands mature. The patterns are worth understanding because investing in customization that fits the current stage typically outperforms investing in customization that fits a future stage.
Stage 1 (under $5M revenue). Most brands benefit from minimal customization at this stage. The platform should be configured well, the brand should be expressed through content and design choices that the theme supports, and engineering investment should be focused on product, not platform. Brands that over-customize at this stage typically discover that the customizations were premature when the business pivots.
Stage 2 ($5-25M revenue). Brands at this stage benefit from selective customization in high-leverage areas: hero PDPs, checkout for the brand's distinctive flow, first-party data architecture. Customization beyond these areas usually does not earn its cost yet.
Stage 3 ($25-100M revenue). Brands at this stage are increasingly differentiated by their commerce experience. Customization investment expands to storefront design, content commerce integration, custom search and discovery, and CRM/data architecture. The platform's customization ceiling becomes a meaningful constraint for brands operating at the top of this range.
Stage 4 ($100M+ revenue). Brands at this stage often need flexibility that constrains the platform options materially. The decision to invest in Adobe Commerce-based customization, full headless architecture, or composable commerce becomes appropriate. The customization investment is significant but the brand revenue justifies it.
What This Means for the Platform Decision
The data suggests several principles for brands selecting platforms.
Match the platform's customization model to the brand's stage and customization ambition. Over-customization at early stages produces technical debt; under-customization at later stages produces brand commoditization.
Treat customization as architectural investment, not tactical execution. The customizations that compound are the ones that fit the broader architecture; the ones that compete with the architecture produce ongoing cost.
Use velocity as a leading indicator of platform health. Brands that can ship customer-facing changes weekly are usually in better platform health than brands that ship monthly or quarterly. Platforms or implementations that slow velocity below the brand's strategic needs are problematic regardless of their individual capabilities.
Invest in customization where the conversion data supports it. The customization patterns with consistent positive conversion impact are worth their cost; the ones with weak or negative data should be approached skeptically regardless of competitor practice.
Work with partners who hold the architectural perspective and the data discipline alongside the design and execution capability. The right partner will push back on customization that does not earn its cost and propose customization where the data supports it.
According to research from Forrester on commerce platform customization economics, brands that maintain customization discipline through their growth stages outperform brands that customize tactically by approximately 30-40% on platform operational efficiency over five-year horizons, with corresponding improvements in time-to-market for new initiatives.
The customization decision is not a one-time choice. It is a continuous discipline that shapes the brand's commerce trajectory over years. The brands that get the discipline right build commerce experiences that feel distinctive without becoming brittle. The brands that get it wrong end up with commerce experiences that feel cluttered, slow, and increasingly hard to evolve.
The data favors discipline. The marketing favors customization. Choose with the data.